---
title: "Monitoring"
diataxis: reference
applies_to:
product: "nirmata-control-hub"
audience: ["platform-engineer"]
last_updated: 2026-04-16
url: https://docs.nirmata.io/docs/control-hub/monitoring/
---
> **Applies to:** Nirmata Control Hub 4.0 and later
As an admin or security professional, you need to view the details of all activities (audit) and events initiated or performed on Nirmata Control Hub. This information is required not only for troubleshooting but also for checking Kyverno policy compliance.
The Policy Monitor provides you with activity details, events, policy health, and policy engine health information.
---
## Activity
Activity/Audit enables security administrators to view operations performed or initiated in Nirmata Control Hub. It also helps track operations performed on Kyverno resources such as Policies and Cluster Policies inside managed clusters.
To view the activity log details:
1. Go to **Menu**>**Monitor**>**Activity**. The Activity page displays logs for all users.
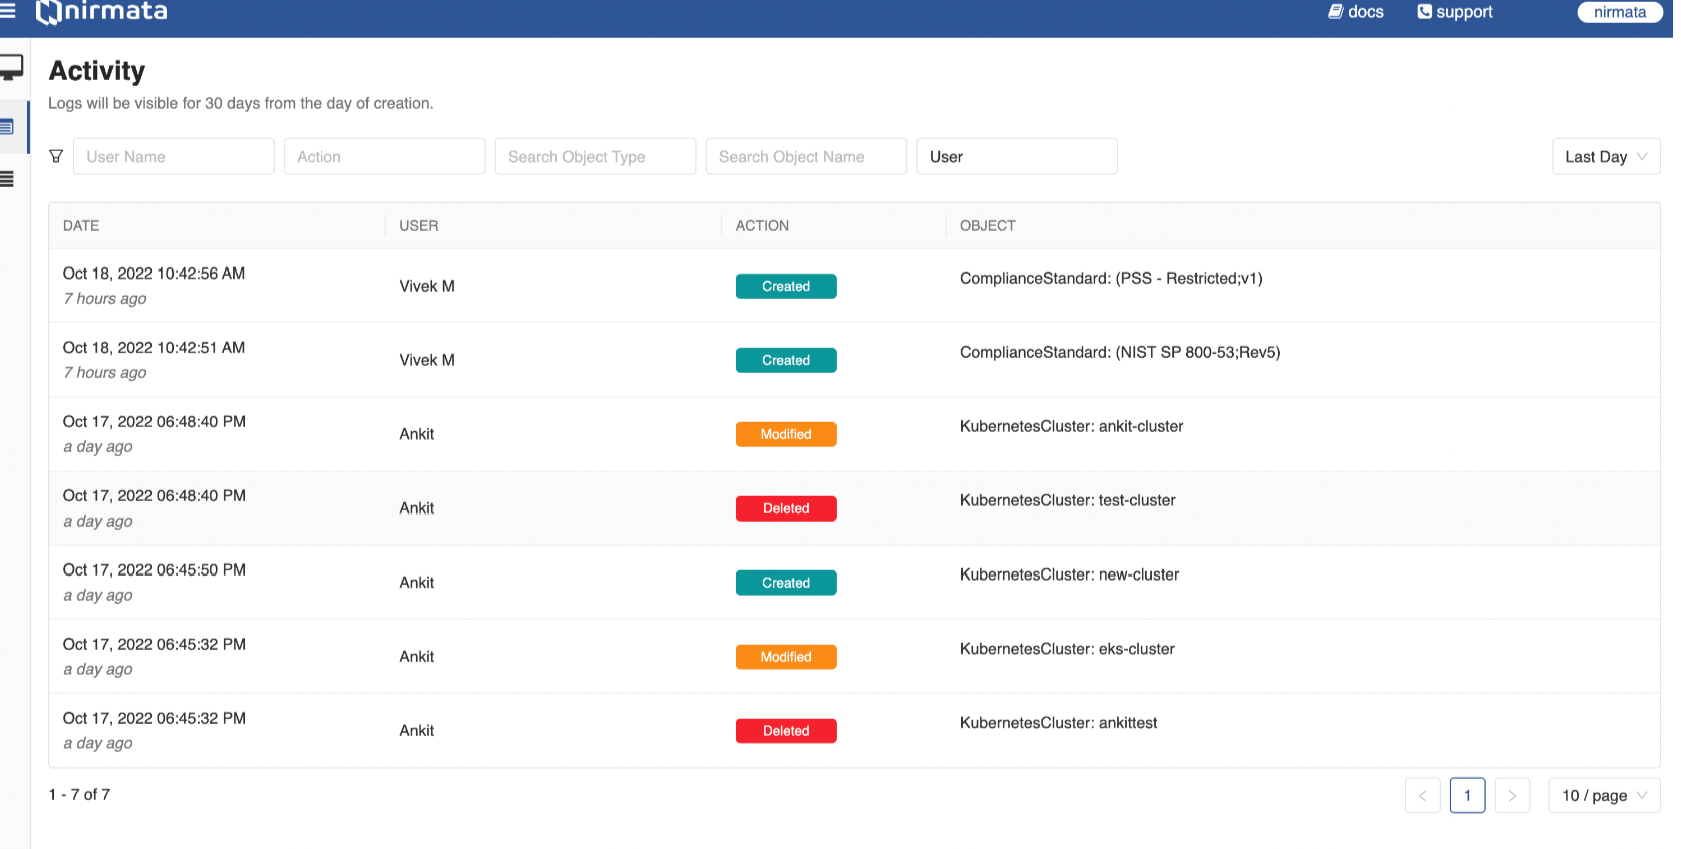
2. If you want to see the Activity for a particular user, then in the User Name filter field, enter the user name for whom you want to view the Activity.
3. If you want to view Activity for a particular action, select from the Action filter field. Available options are: Created, Modified, Deleted, and State Change.
4. If you want to view Activity for an Object Type, use the Search Object Type field to either select from the list or enter a specific object type (for example, Alarm).
5. If you want to view Activity for an Object Name, use the Search Object Name field to either select from the list or enter a specific object name (for example, a policy name).
6. To filter between user and system activities, use the User filter field. Available options are: All, User, and System.
7. By default, Activity is displayed for the Last Day. You can change this to Last Hour, Last Week, Last Month, or Custom using the drop-down list in the top right corner of the page.
8. For Custom date ranges, select both the **From** and **To** dates to view Activity for that specific period.
9. By default, 10 activities are displayed per page. You can adjust this using the page filter at the bottom right corner. Available options are: 10, 25, 50, and 100.
> NOTE: Activity logs are retained for 30 days from the date of creation.
---
## Events
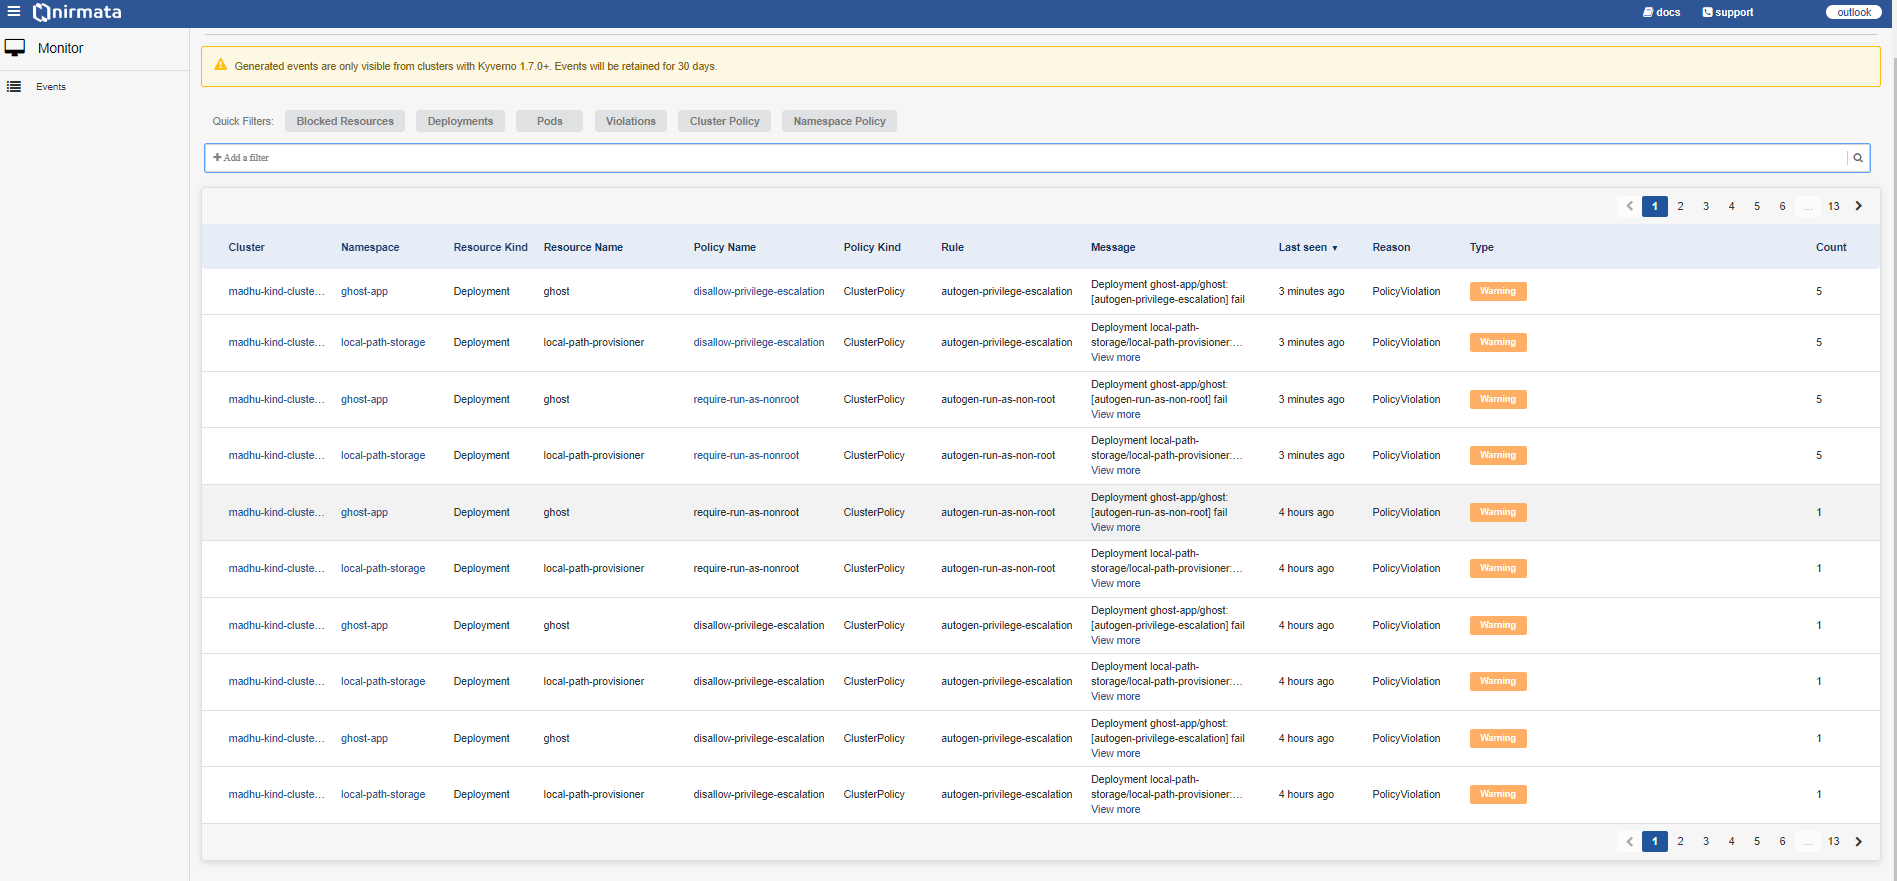
When resources are blocked due to enforced validation failure actions in Kubernetes clusters, Kyverno policies generate events for them. As an admin, you can view these events for all blocked resources with details such as cluster, namespace, policy name, rule, last seen time, and more. These events enable admins to take necessary actions to unblock resources in clusters.
> NOTE:
a) Events are generated only for clusters running Kyverno release version 1.7.0 and later.
b) Events for blocked resources are stored for 7 days.
To view the events for blocked resources:
1. Go to **Menu**>**Monitor**>**Events**. The Events page with the details on blocked resources is displayed.
The following table explains what details are displayed in each column:
Column Name | Description
-----|--------
Cluster | Displays the cluster name where the event appears. You can click the cluster name to view cluster details.
Namespace | Displays the namespace of the cluster. You can click the namespace link to view namespace details.
Resource Kind | The concrete representation of resource type. This is the target object on which the event occurred.
Resource Name | The concrete representation of the resource name. This is the target object on which the event occurred.
Policy Name | Displays the policy name for which the event was generated. You can click the policy name to view the deployed policy.
Policy Kind | Displays the kind of policy for which the event was generated. Values can be: Cluster Policy (Cluster) or Policy (Namespace).
Rule | Displays the policy rule for which the event was generated.
Message | Displays the path from Cluster to Rule and the associated message. Also displays any errors in the generated events.
Last Seen | Displays the timestamp for each event.
Reason | Displays the reason for the generated event, for example, policy violation.
Type | Displays the type of blocked events such as warning. Color indicators: Yellow - warning messages, Grey - normal messages.
Count | Displays the number of times the event was triggered.
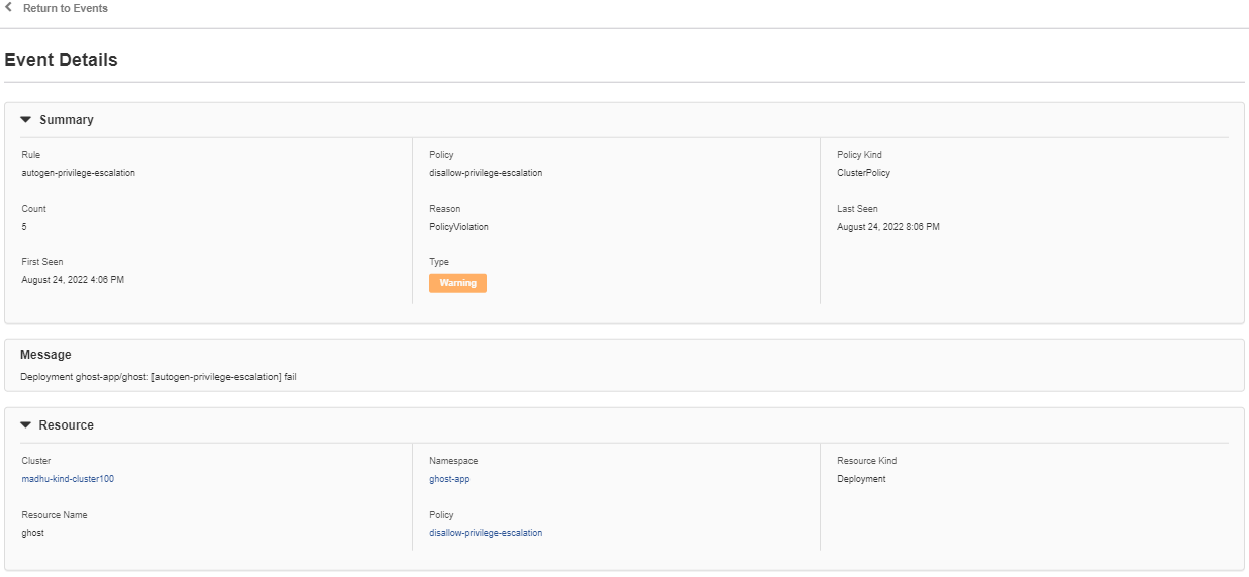
2. Click on the cluster. The cluster details page is displayed as a sliding window. This page is divided into three sections: Summary, Message, and Resource.
The following table explains the display elements in each section:
Column Name | Description
-----|--------
**Summary** |
Rule | This value displays the policy rule on which the event is generated.
Count | This value displays the number of times the event is triggered.
Reason | This value displays the reason for the event generated, for example, policy violation.
Last Seen | This value displays the last seen time stamp for the event.
First Seen | This value displays the time stamp for the event.
Type | This value displays the type of blocked events such as warning. The following are the Color indicators in this value: Yellow - indicates warning messages. Grey - Indicates the normal message.
**Message** | This value displays the path that is applicable for the events from Cluster to Rule and then the message. It also displays the error on the events generated.
**Resource** |
Cluster | This value displays the cluster name on which the event appears.
Namespace | This value displays the namespace of the cluster.
Resource Kind | This value is the concrete representation of resource type. This is the target object on which the event has occurred.
Resource Name | This value is the concrete representation of the resource name. This is the target object on which the event has occurred.
Policy | This value displays the policy name on which the event is generated for blocked resources.
3. Go to **Quick Filter**>**Add a Filter** to add a filter for events. A list of available filters such as Cluster, Namespace, Resource Kind, Resource Name, Policy Name, Policy Kind, Rule, Message, Reason, and Type will be displayed. Select a filter value (for example: Message), add the keyword (blocked) to filter events, and click **Apply**. This will display only blocked events.
Alternatively, click on filter tabs such as **Blocked Resources**, **Deployments**, **Pods**, **Violations**, **Cluster Policy**, and **Namespace Policy** to see the relevant events.
---
## Kyverno & Policy Health
The Kyverno Health Check feature in Nirmata Control Hub provides visibility into the operational health and configuration best practices of your Kyverno installation. It continuously analyzes Kyverno deployments across your clusters and offers a detailed health score based on four key categories:
* Security
* Availability
* Scalability
* Observability
Each category is evaluated independently and flagged as Healthy, Warning, or Critical based on current configurations. The overall health score is then calculated and displayed prominently in the UI.
## Key Benefits
* **Instant Health Grade**: See at-a-glance how well Kyverno is configured in your environment.
* **Detailed Diagnostics**: Get category-wise breakdowns with precise issues and configuration gaps.
* **Remediation Guidance**: View recommended changes to restore Kyverno to optimal health.
* **Proactive Alerts**: Identify and resolve misconfigurations before they affect policy enforcement.
## Health Categories Overview
### Security
Evaluates security-related configurations including:
* **RBAC Validation**: Role-based access control configurations
* **Network Policy**: Network segmentation and traffic controls
* **Cluster-Admin Binding**: Excessive privilege assignments
### Availability
Assesses deployment resilience and reliability:
* **Resource Configuration**: CPU and memory requests/limits
* **High Availability**: Pod disruption budgets and replica counts
* **Runtime Stability**: Pod restart patterns and health
### Scalability
Reviews auto-scaling and performance configurations:
* **Auto-scaling**: Horizontal Pod Autoscaler setup
* **ETCD Optimization**: Reports server deployment status
* **Replica Management**: Controller replica distribution
### Observability
Monitors health and monitoring capabilities:
* **Controller Health**: Component operational status
* **Pod Health Probes**: Readiness and liveness probe configuration
## Using the Kyverno Health Dashboard
### Accessing Health Information
1. **Navigate to Health Tab**
- Go to **Control Hub** → **Select Cluster** → **Health** tab
- View your overall Kyverno Health Grade (e.g., Score: 8/16, Status: F)
2. **Understanding Health Status**
- **Healthy** (Green): Component meets best practice standards
- **Warning** (Yellow): Minor issues that should be addressed post measuring the impact
- **Critical** (Red): Serious problems requiring immediate attention
### Interpreting Health Results
#### Overall Health Score
- The health score shows how many checks passed out of total checks
- Letter grades (A-F) provide quick assessment of overall health
- Hover over the score for additional context
#### Category-Specific Analysis
1. **Expand each category** (Security, Availability, Scalability, Observability)
2. **Review individual checks** within each category
3. **Check status indicators** for each component
### Finding Recommendations and Solutions
#### Using Info Buttons
- **Click the info (ℹ️) icon** next to any health check item
- **View detailed explanations** of what the check evaluates
- **Access step-by-step remediation guidance** provided by the system or
- **Reach out to support for personalized guidance at support@nirmata.com**
### Health Check Navigation Tips
#### Prioritizing Issues
- **Start with Critical findings** as they impact cluster stability
- **Address Warning items** during maintenance windows
- **Use the severity indicators** to plan remediation order
#### Best Practices for Regular Monitoring
- **Check health status weekly** for production clusters
- **Review after any major changes** to Kyverno configuration
- **Include health scores in operational reports**
- **Set up alerts** for critical health score drops
## Getting Additional Support
For environment-specific remediation strategies and best practices tailored to your infrastructure, reach out to support for personalized guidance.
## Additional Notes
* Health checks are **non-intrusive and read-only**
* Evaluations are **refreshed periodically** based on scan frequency
* **No cluster modifications** are made by the health check process
* Remediation guidance is **accessible through the dashboard interface**
## Policy Health
### Policies Tab
The **Policies** tab provides a comprehensive view of all Kyverno policies deployed in your cluster, displaying their current health status, type (validate/mutate), and last update timestamps. Each policy is evaluated for its operational health, configuration correctness, and performance impact, with status indicators showing whether policies are functioning as expected or require attention. This view helps administrators quickly identify problematic policies, track policy deployment success, and ensure that security and governance rules are actively enforced across the cluster environment.
### Policy Exceptions Tab
The **Policy Exceptions** tab displays all active policy exceptions in your cluster, showing their name, target namespace, current state, and expiration dates. Policy exceptions allow you to temporarily or permanently exclude specific resources from policy enforcement while maintaining audit trails and governance oversight. This centralized view enables administrators to monitor exception usage, track their lifecycle, ensure exceptions are properly justified and time-bounded, and maintain security posture by preventing exception sprawl across the cluster infrastructure.